What I Built
I built the whole project: an Airflow workflow represented as a directed acyclic graph (DAG), six Glue jobs, the Athena table definitions and the regression notebook.
Master’s degree capstone
A cloud pipeline that pulls five public Centers for Medicare & Medicaid Services (CMS) hospital quality datasets, curates them on Amazon Web Services (AWS) and fits a regression model of a constructed infection index.
Problem
CMS publishes hospital quality measures in separate datasets. This project joins them by hospital and examines associations between selected quality measures and an infection index constructed from standardized infection ratios. The research question: can the selected measures explain variation in that index?
Role and scope
I built the whole project: an Airflow workflow represented as a directed acyclic graph (DAG), six Glue jobs, the Athena table definitions and the regression notebook.
The implementation includes ingestion, curation, the regression dataset, a fitted ordinary least squares (OLS) model and an unpublished Tableau workbook. It is my D610 Data Engineering Capstone for the Master of Science Data Analytics - Data Engineering at Western Governors University.
Scheduling and production hardening: the DAG runs on manual trigger in a local Docker Compose stack. Causal claims about hospital quality.
Architecture
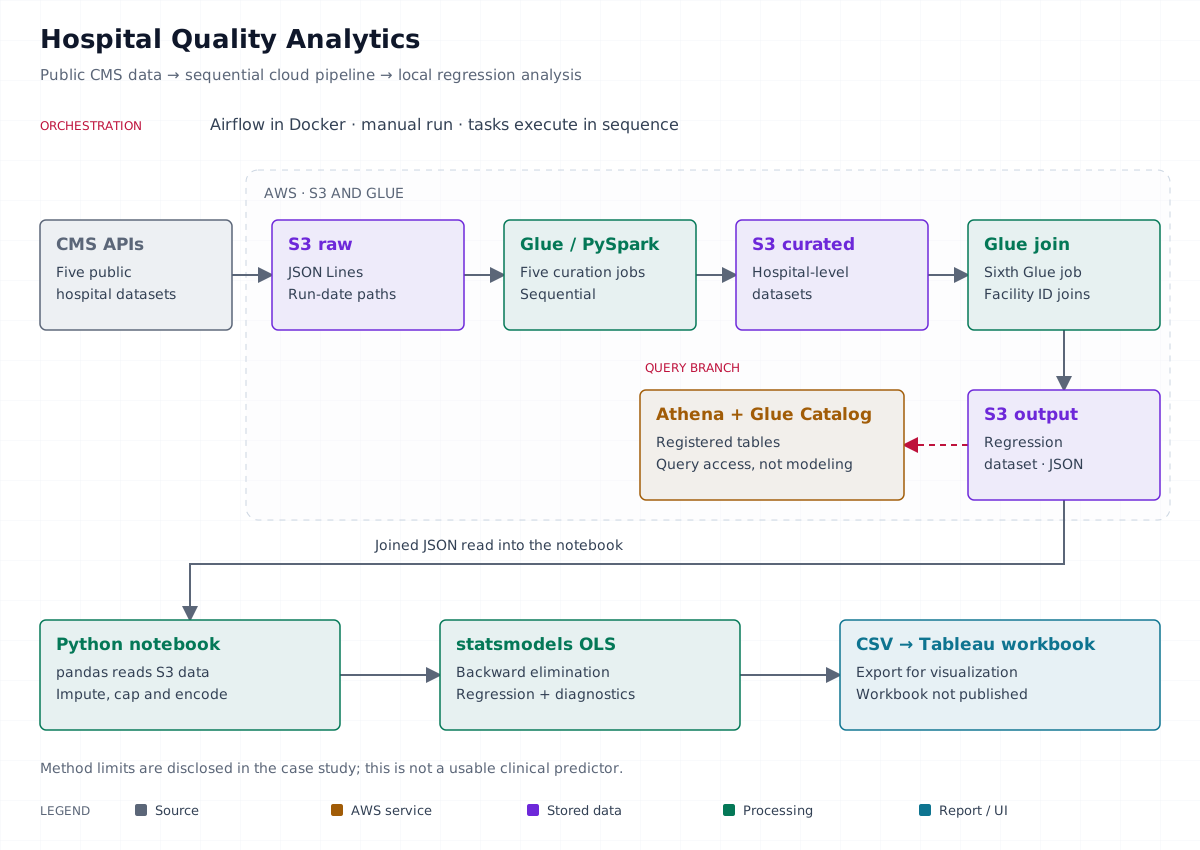
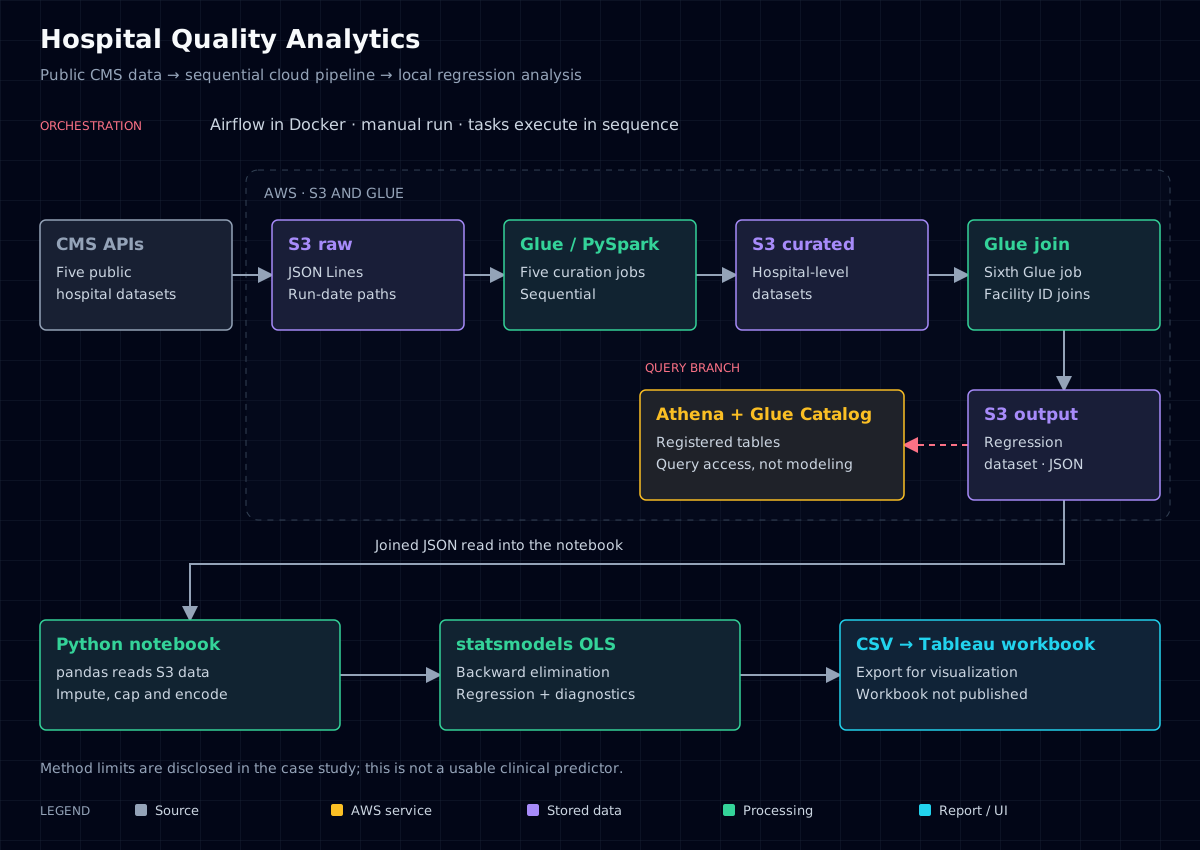
The implemented pipeline, with sequential Glue jobs and a separate query branch.
An Airflow task calls the CMS Provider Data API for five datasets and writes each response to S3 as JSON Lines, keyed by run date.
S3 holds raw, curated and analytics prefixes. Athena data definition language (DDL) statements register raw, curated and regression-dataset tables in the Glue Data Catalog.
Six Glue Studio PySpark jobs clean, filter and pivot each domain, then join them into one regression dataset per hospital.
One Airflow DAG, run locally with Docker Compose, performs ingestion and then the six Glue jobs in sequence.
The regression dataset is stored as JSON in S3 and registered in the Glue Data Catalog for the notebook and later tools.
The notebook exports a hospital-level CSV for a Tableau workbook. The dashboard is not published.
Key decisions
The DAG decodes each API response and stores its records as JSON Lines in S3 before cleaning, under a run-date key. Trade-off: a rerun on the same day overwrites that day’s file, so the stored history is per day rather than per run.
Cleaning, pivoting and the multi-source join run as Glue PySpark jobs; the SQL files only define Athena external tables over each layer. Trade-off: the logic lives in generated Glue Studio scripts, which are harder to review than SQL models.
The notebook fits ordinary least squares and drops predictors by p-value, so each remaining coefficient reads as an association with the infection index. Trade-off: the model explains little of the training variation and p-value selection can overfit.
Evidence
Code, setup and configuration rules in the repository.
The Airflow DAG and the Glue jobs.
Athena DDL for the raw, curated and regression-dataset tables.
The regression notebook, with its saved outputs.
Results and limits
Data split
2,396 hospitals
1,916 training · 480 test
The model learns from 1,916 hospitals and is scored on 480 it did not see. The median imputer was fit before this split, so test data shaped the training inputs.
Variation explained
R² 0.102
10.2% of training variation · adjusted 0.096 · F-test p < 0.001
The predictors are jointly significant, so the null hypothesis is rejected. They still explain only about a tenth of the variation in the infection index, so I read the result as associations rather than reliable predictions.
Prediction error
RMSE 0.335
On the 480 test hospitals, in infection-index units
The typical prediction error on test hospitals, in the same units as the infection index. It needs a baseline comparison before it can show added predictive value.
Source: regression notebook
Coefficients from the final model with 95% confidence intervals. Each is the change in the infection index linked to that predictor with the others held fixed. Below zero means a lower index: fewer infections relative to CMS predictions. These are associations, not effects.
Hospital Groups Compared With Their Reference
| Predictor | Compared with | Coefficient | 95% CI | p |
|---|---|---|---|---|
| Low ED volumevs high and very high | vs high and very high | −0.1248p < 0.001 | −0.174 to −0.076 | < 0.001 |
| Proprietary ownershipvs all other ownership types | vs all other ownership types | −0.0819p < 0.001 | −0.126 to −0.038 | < 0.001 |
| Northeast regionvs Midwest | vs Midwest | −0.0791p 0.002 | −0.129 to −0.029 | 0.002 |
| South regionvs Midwest | vs Midwest | −0.0690p 0.001 | −0.110 to −0.028 | 0.001 |
| Medium ED volumevs high and very high | vs high and very high | −0.0616p 0.001 | −0.096 to −0.027 | 0.001 |
| West regionvs Midwest | vs Midwest | −0.0539p 0.026 | −0.101 to −0.007 | 0.026 |
| Overall star ratingper star | per star | −0.0793p < 0.001 | −0.097 to −0.062 | < 0.001 |
| Recommend-hospital ratingper star | per star | 0.0268p 0.003 | 0.009 to 0.045 | 0.003 |
| Pulmonary embolism or DVT rateper unit of the CMS rate | per unit of the CMS rate | 0.0222p 0.036 | 0.001 to 0.043 | 0.036 |
| Staff flu vaccinationper percentage point | per percentage point | 0.0014p 0.001 | 0.001 to 0.002 | 0.001 |
| ED length of stayper minute | per minute | 0.0006p 0.001 | 0.000 to 0.001 | 0.001 |
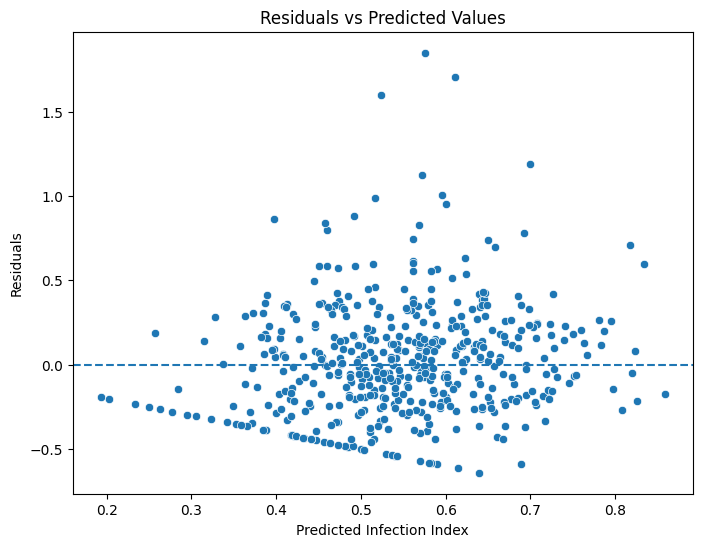
Source: regression notebook
2,396 hospitals, split 1,916 for training and 480 for testing. The predictors are jointly significant (F-test p < 0.001), so the null hypothesis is rejected, but they explain only 10.2% of the training variation (R² 0.102, adjusted 0.096). Test root mean square error (RMSE) is 0.335: it measures prediction error in infection-index units. Source: notebook.
Public CMS Provider Data hospital quality measures. The outcome, the infection index, averages a hospital’s available standardized infection ratios (SIRs) across up to six measures. Each SIR compares observed infections with the number predicted by CMS; a value below 1 indicates fewer observed infections than predicted. Source: infection-index transformation.
The results describe associations rather than causes. The imputer is fit before the train/test split, so test data shapes the training inputs. Test RMSE needs a baseline comparison to establish added predictive value. The overall star-rating predictor also summarizes infection measures under CMS’s methodology, so it is not independent of the outcome’s subject matter. The number of contributing infection measures can differ by hospital, which limits comparability.
Lessons
I set out to predict infection rates. My analysis instead models a constructed infection index. The predictors are jointly significant but explain about 10% of its variation in the training data, so I interpret the result as associations rather than reliable predictions.
The median imputer saw all 2,396 hospitals before the 80/20 split, so test data shaped the training inputs. Fitting it on training rows only, inside a pipeline, keeps the test score honest.