What I Built
The whole system, alone: simulator, FHIR ingestion, streaming services, lakehouse jobs, dbt models, quality checks, model training and scoring, dashboards, Terraform, CI, a local stack and the simulation study.
Personal project
An Amazon Web Services (AWS) demonstration that combines synthetic Synthea patient records with replayed public Beth Israel Deaconess Medical Center (BIDMC) waveform-derived vital signs and synthetic bedside measures. Fast Healthcare Interoperability Resources (FHIR) observations feed a realtime dashboard with live National Early Warning Score 2 (NEWS2) and a governed lakehouse with daily scoring for a synthetic proxy of repeated extreme readings. A simulation study tests how well models recover a planted early-warning signal.
Replay
A demonstration deployment streamed readings for 10 synthetic patients. The live dashboard's WebSocket feed was recorded for 31 minutes: 11,309 frames. Heart rate, breathing and oxygen saturation update every few seconds; blood pressure, temperature, inhaled oxygen and consciousness level arrive about every 5 minutes. Replay them here at up to 16 times speed, with no AWS resources running.
Recorded demonstration data: synthetic Synthea patients with replayed public BIDMC waveform-derived values, shown exactly as recorded. It is not live and not clinical.
Problem
A realtime view needs timestamped readings; analysis needs history that can be checked and modeled. This demonstration builds both from one event stream containing fictional patient records and replayed public waveform-derived vital signs.
Role and scope
The whole system, alone: simulator, FHIR ingestion, streaming services, lakehouse jobs, dbt models, quality checks, model training and scoring, dashboards, Terraform, CI, a local stack and the simulation study.
Realtime path, lakehouse, star schema, quality gates, lineage, daily scoring, bedside measures, live NEWS2 with real-time early-warning scoring, Grafana dashboards and an ingestion check, accepted in the release. All of it ran on AWS: the release checks, the replay above and separate checks of early warning, Grafana and ingestion. Grafana also runs locally, as does the simulation study.
Identifiable patient records, clinical validation and an always-on service. The AWS stack runs for demos and tests, then is torn down.
Architecture
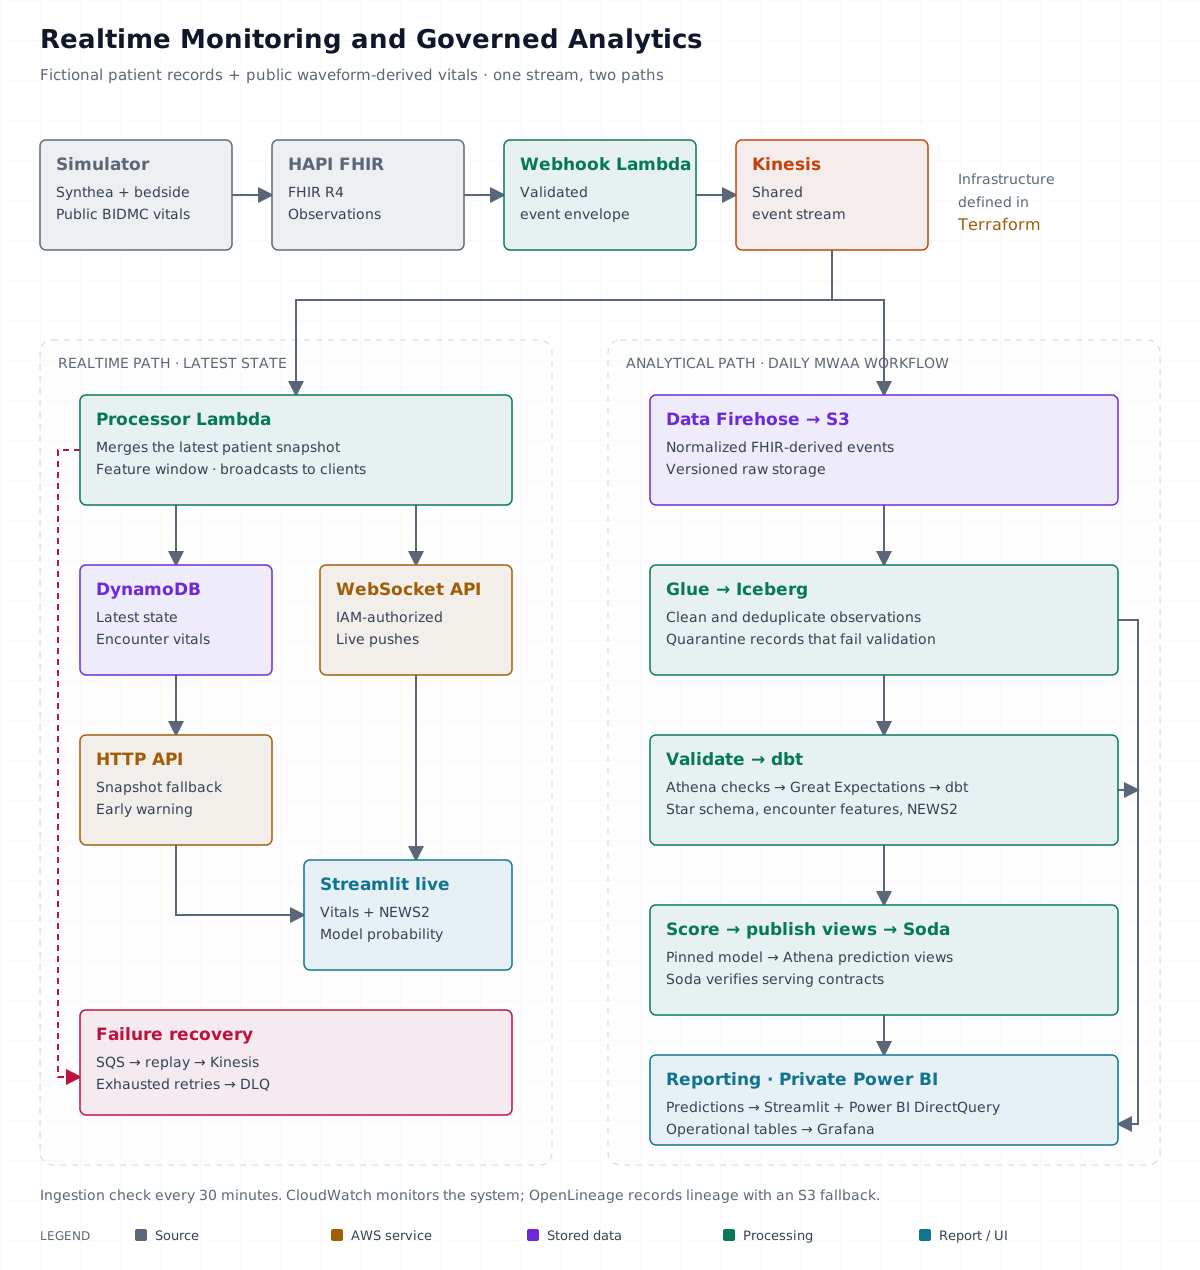
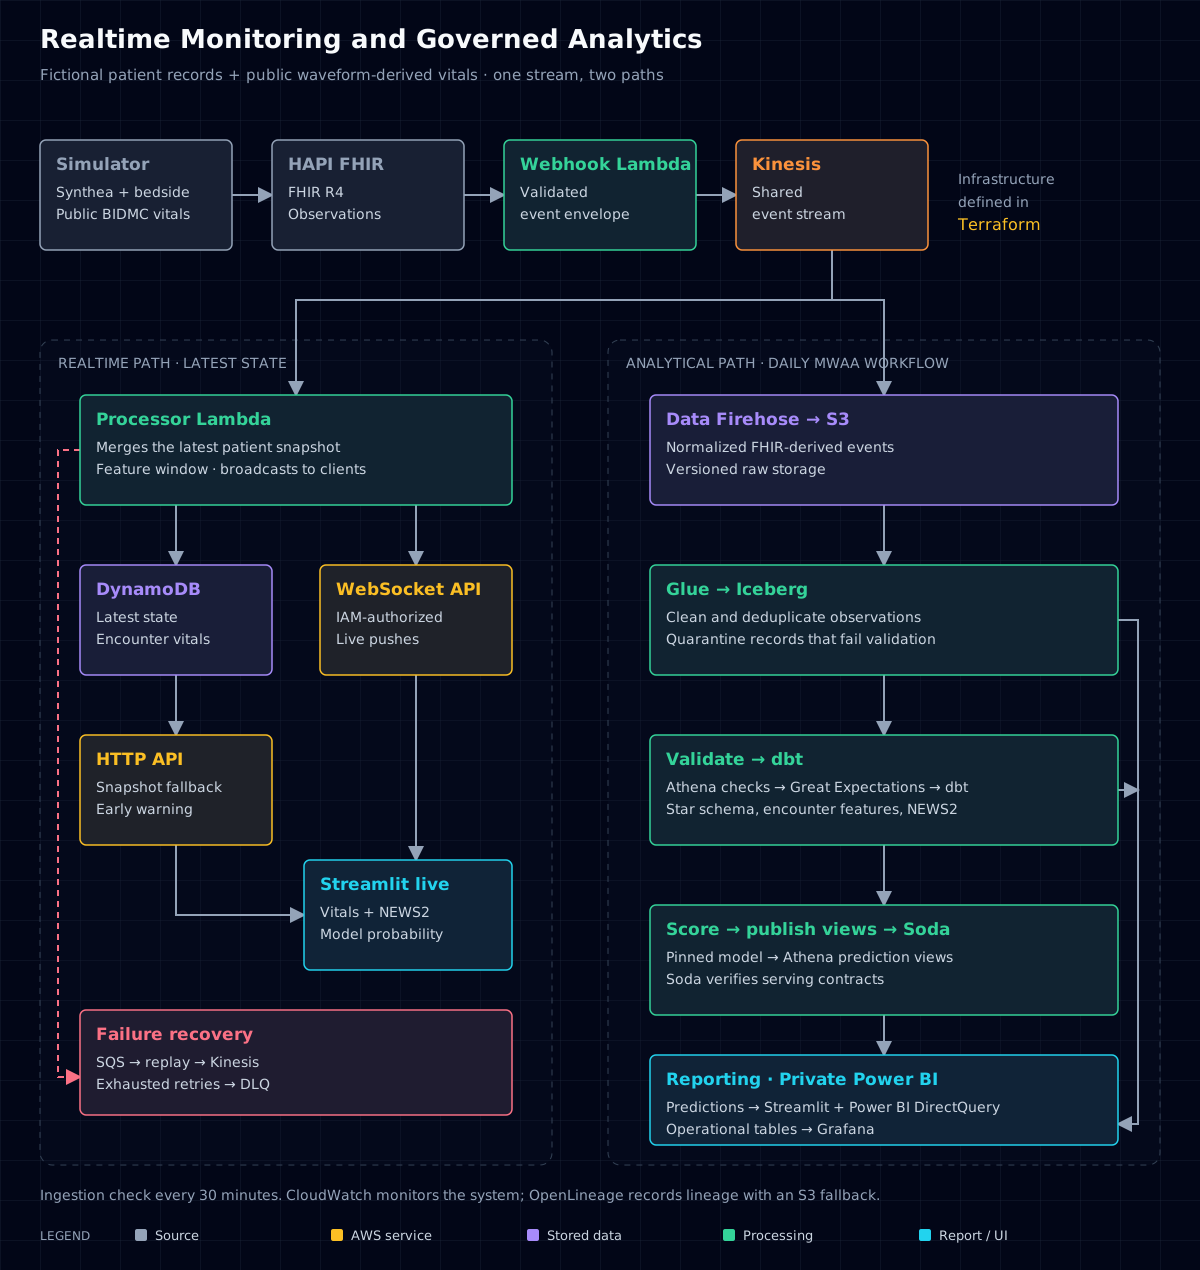
Two paths from one demonstration stream with fictional patient records and replayed public waveform-derived vital signs.
Synthetic Synthea patient records, replayed public BIDMC waveform-derived vitals and synthetic bedside measures are published to HAPI FHIR. FHIR R4 provides a standard format for exchanging health records; Logical Observation Identifiers Names and Codes (LOINC) identifies each vital sign.
DynamoDB holds current patient state and encounter vitals with a two-day expiry, S3 keeps the raw event history and Iceberg tables in the Glue Data Catalog hold processed observations. A local PostgreSQL warehouse holds the simulation study's data.
Glue PySpark jobs clean and deduplicate events. dbt on Athena builds a Kimball star schema with Type 2 provider history, encounter feature tables, NEWS2 at the end of each feature window and per-vital trend slopes. The same models run on the local PostgreSQL warehouse.
MWAA Serverless runs the daily workflow in dependency order: Glue, validation, the cohort reference extract, dbt, scoring, prediction views and Soda, with lineage recorded along the way. A second workflow checks ingestion every 30 minutes. Terraform defines the application's AWS resources; account prerequisites such as secrets and deployment policies are managed separately.
A Lambda processor merges each event into DynamoDB and pushes it over a WebSocket API. An IAM-authorized HTTP API returns the latest snapshot when a socket drops and serves NEWS2 with the model's early-warning score.
A Streamlit realtime cohort dashboard shows vitals, live NEWS2 and the approved model probability when available. A separate Streamlit model analytics dashboard and a private Power BI DirectQuery report read Athena prediction views. The Power BI report uses Power Query and Data Analysis Expressions (DAX). Grafana queries operational tables for pipeline operations, quality and capacity.
Key decisions
I moved the workflow from a provisioned MWAA environment to MWAA Serverless. The Python DAG still runs on any Airflow; a generator converts it to the Serverless definition. Trade-off: that definition must be regenerated whenever the DAG changes.
Scoring loads an explicitly approved, checksummed model version. Training refuses to run until both partitions contain both label classes. Trade-off: a new model needs a review step before it scores anything.
I retain raw event history for audit and replay. Glue quarantines rejected records and merges accepted, deduplicated observations into Iceberg. dbt staging selects the configured cohort and valid encounter IDs: 10 patients on AWS and up to 100 locally. Trade-off: row counts differ by layer, so each layer’s grain has to be documented.
The simulation study plants a seeded early-warning trend in most deterioration encounters and keeps a null control with none. A calibration on a separate seed set the signal's strength before the analysis plan was frozen. Trade-off: the results show how well a method recovers a planted signal, not clinical performance.
Evidence
Code, Terraform, tests and runbooks in the repository.
Test, workflow, load-test, alarm and teardown results in the release notes.
Quality gates, quarantine and replay in the data governance guide; table grain in the star schema guide.
Every change in the changelog, including the simulation study and its calibration.
Training windows and evaluation in the model training guide; the Athena link behind the Power BI report in the connection guide.
Results and limits
762
Python tests passed
Local validation passed 762 Python tests, Ruff, MyPy, the Soda contracts, the workflow tests, the Terraform plan tests and every repository hook.
Source: release notes
10
workflow tasks in one run
With an approved model, one MWAA Serverless run completed all ten tasks, including the cohort reference extract, dbt, scoring, the prediction refresh and Soda.
Source: release notes
1,381 ms
WebSocket delivery at p95 under load
The isolated load test passed with no missing observation in DynamoDB or over WebSocket; delivery took 241 ms at the median and 1,381 ms at the 95th percentile.
Source: release notes
12
alarms OK after the run
All 12 alarms were OK, both failure queues were empty and no replay policy remained. Teardown then destroyed every resource.
Source: release notes
762 Python tests passed with every repository check. One MWAA Serverless run completed all ten tasks with an approved model. Under an isolated load test, WebSocket delivery took 241 ms at the median and 1,381 ms at the 95th percentile, with no missing observation. Source: release notes.
On the calibration seed, a logistic regression reached an area under the curve (AUC) of 0.802 and NEWS2 0.691; on the null control, with nothing planted, they reached 0.501 and 0.480. The study arm uses another seed. Source: changelog.
Synthetic Synthea patient records are combined with replayed public BIDMC waveform-derived vital signs. The model predicts a synthetic deterioration proxy: repeated extreme readings of the same vital sign in the next 15 minutes, from features in the first 15. Source: model training guide and BIDMC dataset provenance.
Not clinically validated and not a production service. The release's model had four test encounters. This supports verification of the governed deployment path rather than a model-performance claim. The study's signal and bedside measures are synthetic by design. The load test measures one isolated run, not sustained production traffic. The Power BI report is private and no dashboard screenshots are published.
Lessons
Keeping the encounter ID at the ingestion boundary mattered most: an identifier lost there cannot be rebuilt reliably later. See the star-schema guide.
The first dashboard followed one patient. Rebuilding it around the whole cohort, with explicit stale states, answered the question that matters: who needs attention now?
The first planted signal turned waveform dropouts into valid readings, but only in deterioration encounters: 537 readings that marked the label. The changelog records the fix. A model could have learned the leak instead of the signal.